
We strongly recommend to use PlotPy instead of guiqwt. First, because guiqwt is not maintained anymore and second, because PlotPy is far more robust and tested. Moreover, you can easily migrate your existing guiqwt-based code to PlotPy thanks to the migration guide.
guiqwt
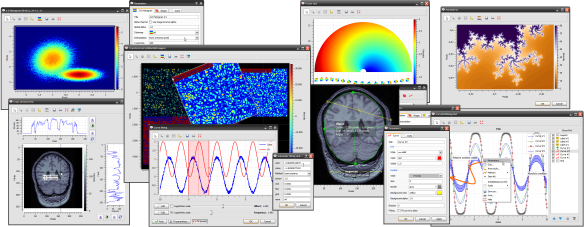
Based on PythonQwt (plotting widgets for Qt graphical user interfaces) and on the scientific modules NumPy and SciPy, guiqwt is a Python library providing efficient 2D data-plotting features (curve/image visualization and related tools) for interactive computing and signal/image processing application development.
- External resources:
Python Package Index: PyPI
Bug reports and feature requests: GitHub
Help, support and discussions around the project: GoogleGroup
Contents:
Indices and tables: